LabVIEW System Exec with callbacks

In my day-to-day LabVIEW development, I perform a lot of System Exec calls. Whether it’s getting the status of my git repositories or communicating with instruments. Some commands execute quickly so a small delay is unnoticeable, however some longer running tasks appear to not be doing anything.

My issue with the standard LabVIEW System Exec vi is that you only have two ways to use it.

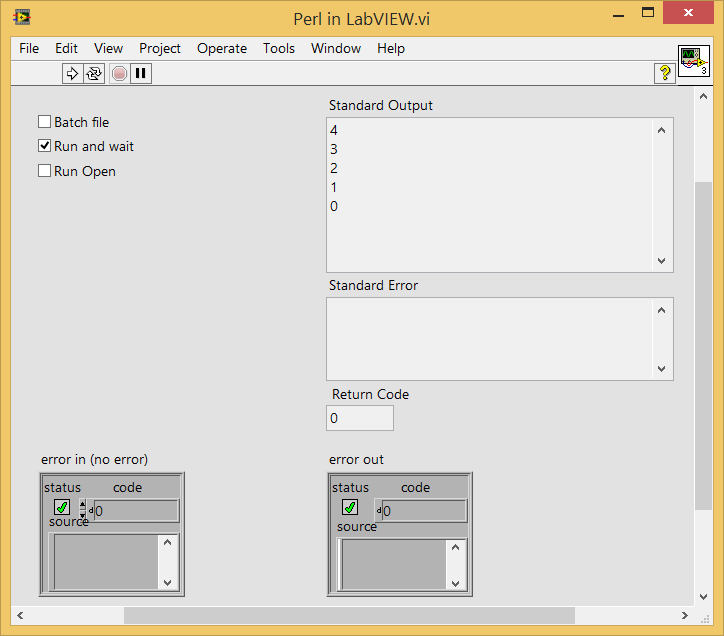
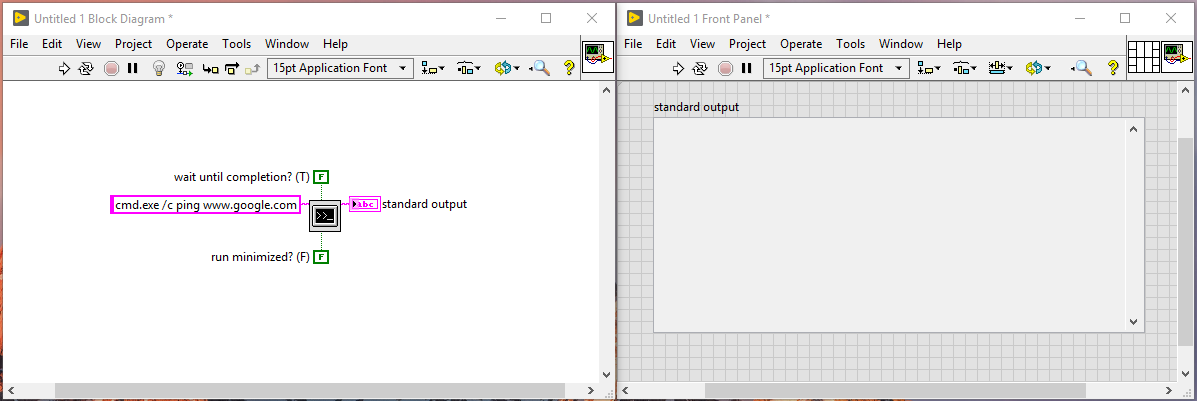
The first is when “wait until completion?” is True, the command runs in a terminal with no progress visible. When the command completes, what should have been written to the terminal during the command’s execution is written to the Standard Output indicator. This method is fine for very quick commands.

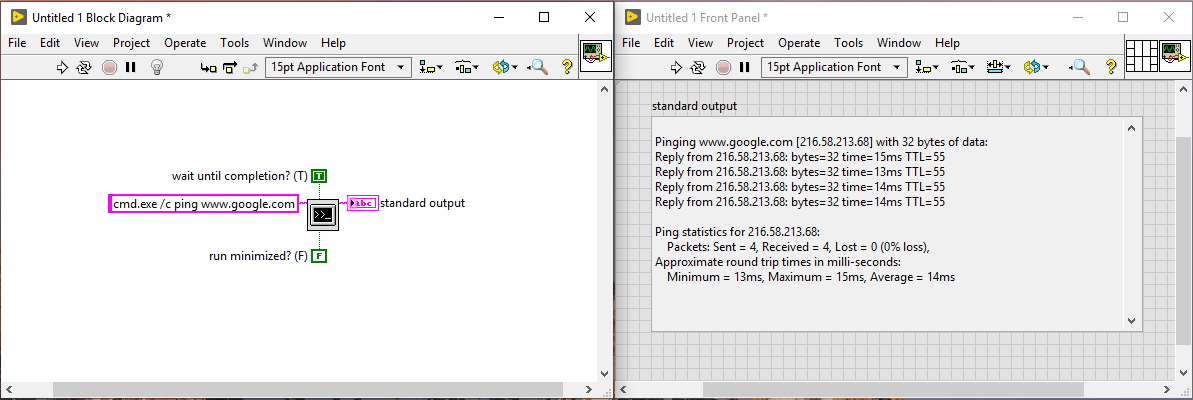
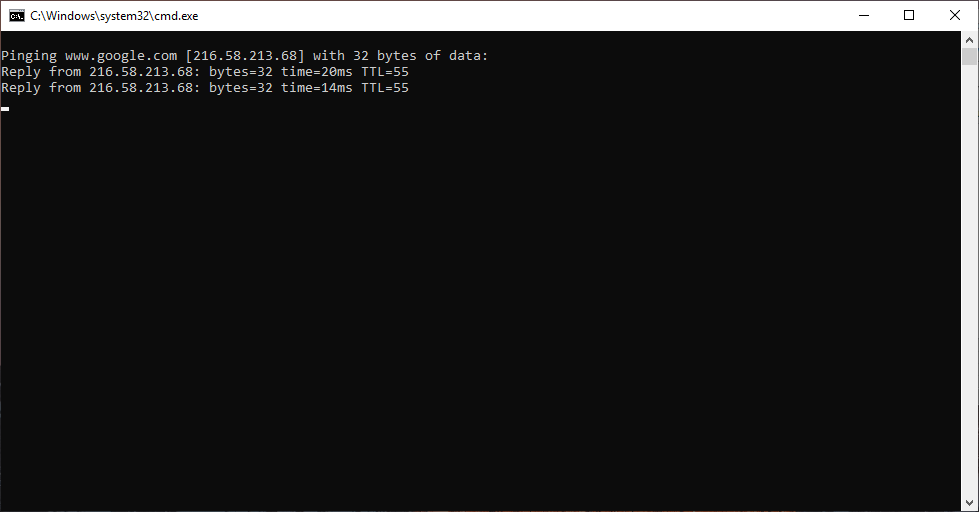
The second method is setting “wait until completion?” to False. This will then open a terminal, display the progress within the terminal window and when complete write nothing to the Standard Output indicator. This method is good to show progress, but when the command completes, you cannot get that output into your LabVIEW application to parse.

What I want is a middle ground where you can get the progress during the command execution AND the final output into your application.

I have been working on a tool lately to manage the many submodules within any of my projects. It uses the LabVIEW project provider framework and runs when projects are opened. I have started to take advantage of git submodules for all my reuse code, drivers and anything that is shared between projects. The tool uses System Exec to execute various git commands. Many of the commands take a while to execute because of the number of submodules within a given project.

Having the user interface appear to hang while the command is executed is not very comfortable for the user. Even though I know the software is working and what is happening in the background, I still feel uncomfortable waiting for a command to execute.

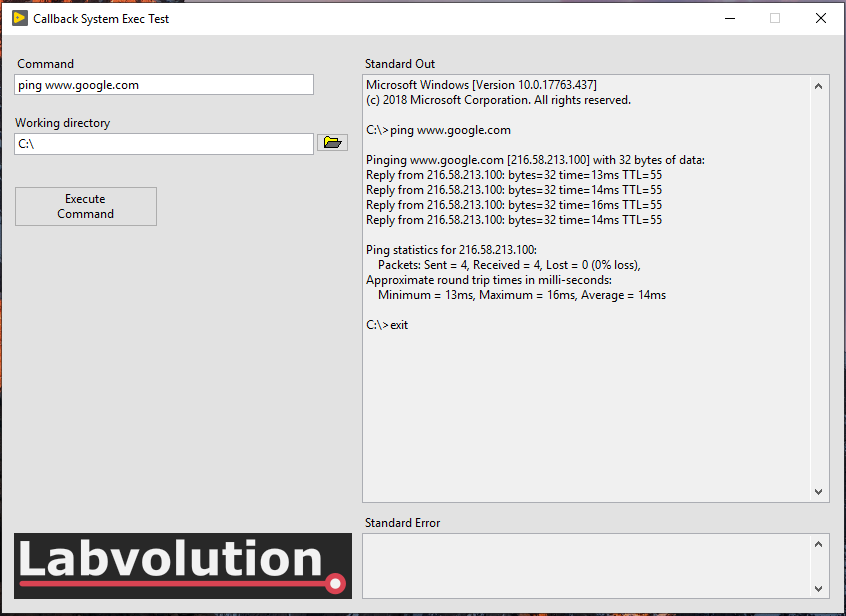
To get around this, I have used two .net classes to execute the command. Callback vi’s are used to register event callbacks which in turn generate LabVIEW events to display progress to the user.


There are two modes of operation for the Callback System Exec vi. The calling vi has the option to create user event references, which it subscribes to, and passes the references into the Callback System Exec vi. When the Callback System Exec vi gets a standard output update, it uses the passed in user event reference to notify the calling vi of the updated standard output text.

If no user event references are passed in from the calling vi, the command will still be executed and once complete, the standard output can be read as a normal indicator. As well as the optionally passed in user event references, the Callback System Exec vi creates its own internal user events which register to the standard output and builds a string to return when complete.

Having the ability to see the response as it happens from a command has a huge advantage when executing long-running commands that a user must wait for.


This Callback System Exec vi has made my submodule tool a lot more user friendly by showing continuously the output from the command. Some commands take 10-15 seconds to execute so seeing nothing in this time can leave the user not knowing what is happening.


If you want to have a look at the code and give it a try, you can clone the repository from bitbucket. Feel free to suggest changes and modifications, fork the repo and collaborate to make it better.


LabVIEW: Discovering New and Old Functions

I have been using LabVIEW Quick Drop for the last few years and find it really useful. I almost never open the functions palette anymore. The one problem I find with Quick Drop (not really a problem with Quick Drop) is that I end up using the same functions over and over again, without discovering new, different or more efficient methods of doing things. By opening the functions palette every now and then, you can quite quickly and easily notice new or unused functions.

This happened to me a few months ago when I stumbled upon the In Range and Coerce function.

LabVIEW In Range and Coerce Comparison pallette

With writing a lot of test software, I am always comparing measured values to target values. When there is an upper and lower limit, I used to use greater than, AND and less than function. This works but I always thought it looked a bit clumsy.

LabVIEW In Greater AND Less than target

Using Quick Drop, and what I thought to be a good search term to find the function that does this in one step proved unsuccessful.

LabVIEW Quick Drop greater and less

Then one day I decided to go looking through the Comparison functions palette and came across the In Range and Coerce function. This did everything I needed and more and I have used it ever since.

LabVIEW Quick Drop In Range and Coerce block diagram

Knowing what the function does and how it works, it’s obvious why it has the name that it does. This does however make it a bit tricky to look for functions without knowing the name of something and just knowing what you want it to do. Sometimes you find what you need and others you don’t.

LabVIEW Quick Drop In Range and Coerce

With the In Range and Coerce function, you can also very easily include or exclude the limits from the comparison.

LabVIEW Quick Drop In Range and Coerce block diagram include limits

I think Quick Drop is brilliant and significantly increases productivity; however I also think it’s a good idea to every now and then just browse through the functions palette to see the many, sometimes unused functions that are available.

LabVIEW Functions palette

Happy programming and enjoy looking for and using those sometimes unused, new or forgotten functions.

Greg

Installing VMware Tools for openSUSE

This is going to be a really quick post about getting VMware tools running using openSUSE. As mentioned previously, I am using virtual machines quite a bit lately and I had a need to install LabVIEW for Linux. I have used Linux a bit, but ran into all sorts of issues. The aim of this blog post is to help anyone out who has the same problem and also serve as a reminder to me when I need to go through the process again.

Installing openSUSE was straight forward, just follow the defaults. The only change I had to make was disk size and memory allocation in the VMware settings.

Once installed, the first stumbling block was to install VMware tools. This is not as straight forward as you would think. There are a few dependencies that are needed and these must be installed manually. These include GCC, make and the kernel header files. This is not made clear while installing VMware Tools.

Open a terminal and run uname -r and uname -m. This will print the kernel name and machine name.

Linux LabVIEW VMware - kernel

Next, open Settings > YaST > Software Management. Search for ‘kernel-source’ and then under the Versions tab, select the version that was listed in the above step. In my case, I selected 3.16.6-2.

Linux LabVIEW VMware - kernel version

Repeat this step for ‘kernel-desktop’ and ‘kernel-desktop-devel’

Next install ‘GCC’ and ‘make’ using the YaST as explained above. Once everything is installed, reboot.

Linux LabVIEW VMware - gcc

Linux LabVIEW VMware - make

Open a terminal and execute the following command. ls /usr/src/linux-3.16.6-2-obj/x86_64/desktop/include/generated/uapi/linux/

This will show the location of the kernel header that VMware Tools will look for.

Linux LabVIEW VMware - kernel source headers

Make the directory where VMware will look for for the kernel header.  mkdir -p /lib/modules/<uname -r>/build/include/linux and copy version.h from the above step into this directory. You can also create a symbolic link, but I have not tested this.

Now extract the tar file from VMware Tools disk that is mounted and run  sudo ./vmware-install.pl. Follow the prompts and it should install OK. Reboot and everything should not work.

Linux LabVIEW VMware - Install complete

While the virtual machine is power off, enable a shared folder. This will be automatically mounted when the OS boots.

Linux VMware Tools - Shared folder

Boot the virtual machine and open a terminal. If everything is set up correctly, you will notice that the shared folder has already been mounted. ls /mnt/hgfs/Shared\ Folder/openSUSE/ will show your shared folder. You will need to change the names depending on your set up.

I have created a symbolic link (short cut) in my Documents folder to the mount directory. This is not needed, but I find it cleaner.

Linux VMware Tools - Shared folder sym link -s

Linux VMware Tools - Shared folder sym link

The next step is to get LabVIEW for Linux installed. That shouldn’t be too much of an issue, I hope!

Greg

myRIO: FPGA SPI Communications

I have had a National Instruments myRIO for a few months but have not had a chance to use it yet. I bought it so that I can get some experience working in LabVIEW Real Time and with the LabVIEW FPGA.

I started off using the default FPGA build and express vi’s but quickly ran into a problem when I tried to use the SPI express vi. Each time I tried to configure the express vi, LabVIEW crashed. After a while this got extremely irritating so I started looking at the myRIO Custom FPGA Project.

myRIO Custom FPGA Project

To use digital IO this project worked really well. Again the problem came when I wanted to interface to an SPI device. I have used SPI a lot in previous projects so understand the concept and how it works. Despite being a project template, with a documentation folder, nowhere does it explain how to use and implement the custom FPGA build. If there is further documentation, please let me know so I can go through it to get a better understanding of the project.

One more small rant before I get on to a solution you can use, is the SPI naming used in the myRIO Custom FPGA Project does not conform to the norm. Again, if I have read and understood it incorrectly, please let  me know.

myRIO SPI Naming Convention

While looking for some documentation on the myRIO project, I came across this example which explains a bit about how to write an SPI driver and also has an example. This example is written for the sbRIO but can be very easily modified to run on the myRIO and also has a nice, simple API. The last section of the NI article outlines in a few lines how to recompile for a different FPGA target. Here is a more detailed description with a few extras that I have added. Firstly, download the example project here.

myRIO SPI Sample project

These are the steps that I followed to to get it working on a myRIO. I’m sure the steps will be very similar when moving to any other FPGA target.

Add your target to the project.

myRIO SPI Add new FPGA target

myRIO SPI Add new FPGA target 2

Once you have the myRIO target added to the project, copy the FIFO‘s and Example_Host SPI Dual Port.vi from the sbRIO FPGA Target to the myRIO FPGA Target. Make sure to copy them to the FPGA Target and not the RT Target. Then copy Example_Host SPI Dual Port.vi and FPGA Reference.ctl from the sbRIO RT Target to the myRIO RT Target.

For my project I decided to use Connector B. Rename the IO that you are going to use for the SPI communications. Your project should now look like this.

myRIO SPI new FPGA Target

Next we have to edit the FPGA code to work with the new references set on the myRIO FPGA. Open Example_Host SPI Dual Port.vi. I have deleted one of the SPI ports as I only need one.

Open FPGA SPI_SPI Port.vi and change the references in the FPGA IO cluster to point to the IO we configured in the previous step. Right click on each reference and select Conifigure IO Type…

myRIO SPI configure new IO references

Select the corresponding reference and then Replace All.

myRIO SPI configure new IO references 2

Do this for each reference. You will notice that when you change the CS reference, the vi breaks. We will fix this next. The reason the vi breaks is that the CS line on the original sbRIO FPGA code was set to a line and not a port. When changing form a line to a port, the element is now boolean and not U8.

The two changes that need to be made to FPGA SPI_SPI Port.vi are removing the Index Array in the Reset CS case and add a Number to Boolean Array and Index Array to the Set CS case. This will test the state of the LSB which will be the CS state.

myRIO SPI configure FPGA CS

myRIO SPI configure FPGA CS 2

Save and close the vi. In Example_Host SPI Dual Port.vi delete the FPGA IO cluster and then add it again by adding a constant to the subvi. This will update the references that have been changed. Save and close all open vi’s. Remove the original sbRIO Target and save the project.

myRIO SPI Removing sbRIO Target

You are now ready to compile your myRIO SPI project. Right click on FPGA SPI_FPGA Top Level.vi and select Create Build Specification. When compiling there are a few choices for where you want to compilation to take place. To compile this locally it took me around 50 min, compared to compiling on the NI Cloud Portal which took less than 10 min.

myRIO SPI NI Cloud Compiler

To access the NI Cloud Portal, you need to register an account as your normal community account does not work here. Once registered you will need to verify your account through an email confirmation. You also need to enter a Product Activation Code. This is not the code that you use as your LabVIEW license. I had to call NI and get them to generate a 20 character code that I entered. You will need an active SSP to get a code generated. The time it takes to call NI and get the code is less than one compilation so is totally worth it.

Once the FPGA compilation is complete, open Example_Host SPI Dual Port.vi. You will notice that the run arrow is broken. To fix this we need to link Open FPGA VI Reference to the correct bitfile. Right click on Open FPGA VI Reference and select Configure Open FPGA VI Reference…

myRIO SPI Configure FPGA VI Reference

Select the Build Specification and then select Overwrite in the dialog that pops up. The vi should now be executable.

Run the vi, select your slave device SPI settings and mode and then press the Write button. You will notice data will be read back.I have a LM74 temperature sensor connected which uses 16 bits SPI mode 0.

myRIO SPI RT Running

There you have it. SPI running on a myRIO FPGA with an API which can be used on an RT host.

As usual, if you have an questions or advice, please feel free to get in touch.

Download myRIO SPI Example Code

Greg

Executing Perl scripts in LabVIEW

The project that I am currently working on requires Perl scripts to be executed through a LabVIEW application which configures the UUT. As Perl is not natively supported by Windows and LabVIEW (I might be wrong here), other tools are needed in order to execute the scripts correctly.

As the scripts were developed on Linux, there was never an issue running them before developing the LabVIEW application.

Running Perl scripts on Windows

First we need to be able to execute the Perl scripts on Windows, then we can move on to LabVIEW.

The tool I am using is called Cygwin.

Cygwin is:

  • a large collection of GNU and Open Source tools which provide functionality similar to a Linux distribution on Windows.
  • a DLL (cygwin1.dll) which provides substantial POSIX API functionality.

To install Cygwin, these are the steps I took:

  • Download and install the your require for your PC
  • Select the Root Directory (C:\Users\gpayne)
  • Select the Local Package directory (C:\cygwin)
  • Select Available Download Sites: http://cygwin.mirror.constant.com
  • When selecting packages make sure you select perl(under Interpreters Group) and ssh (under Net Group) packages.
  • Ensure to add the shortcut to the desktop (We will use this later)

Once installed, running the shortcut on the desktop will open a terminal.

Cygwin Mintty terminal

The pwd command will give you the location and should be the same as set by the Root Directory above.

Create a Perl script in that directory. As an example I have created a Perl script that just prints a number for 5 seconds and then exits. To run the script, enter ./Test_Script.pl in the command line and watch as it runs.

#!/usr/bin/perl -s

my $number = 5;
while($number--)
{
print "$number\n";
sleep 1;
}
exit 0;

Cygwin Mintty terminal running Perl script

Running Perl scripts in LabVIEW

To execute an external application from LabVIEW, one way is to use the System Exec vi. This covers executing the application/script, however Windows is still not able to run a Perl script if it is just called.

The first thought that popped in my mind was to use a batch file.

Using Windows batch (*.bat) files

After doing a bit of research, I found a simple way of calling the Perl script, using bash.exe from a batch file.

@echo off

C:
chdir C:\Users\gpayne\bin

bash --login -c "./Test_Script.pl"
exit 0

This batch file, navigates to the bin directory that was installed by Cygwin and executes the Perl script using bash. The batch file then exits when the script completes.

To accomplish this in LabVIEW is really simple. Just pass the path of the batch file into the command input of System Exec and run the vi. The file runs and the output is reported.

LabVIEW system exec batch file Perl script

LabVIEW system exec batch file Perl script output

This is great because now we can run a Perl script on Windows through LabVIEW and get the Standard Output and Return Code once the script is complete.

This worked well until I started seeing times when the batch file would not exit. I tried all the escape codes that you can call on exit but nothing worked consistently.

The Perl script would execute perfectly every time when run in the terminal, but when run from the batch file and LabVIEW, it would not.

This was not acceptable so I had to look for another way to execute the script successfully every time.

Using Cygwin and Mintty.exe

As the Perl script worked perfectly when run in the terminal, I started looking at ways of replicating it from within LabVIEW. First was to look at what was run when you double click the desktop shortcut. The target points to C:\Users\gpayne\bin\mintty.exe -i /Cygwin-Terminal.ico - and this is what got me started.

I noticed that the application that is run is called Mintty.exe so I took a look at the help file. To get the help file, just type mintty --help at the terminal.

Cygwin Mintty terminal help

I was not interested in the --icon option, but the --exec option looked promising. This got me thinking of what I wanted to execute using Mintty.exe. I needed to execute my Perl script using bash.

So I started to build up my string that I would write to System Exec in LabVIEW. After some trial and error, I was successful in executing the Perl script. This is what I came up with.

C:\Users\gpayne\bin\mintty.exe -e /bin/bash -c '/home/gpayne/Test_Script.pl'

The bash help files are also helpful so from the terminal type bash --help or bash -c "help set".

This would execute the Perl script with bash running in Mintty. This was all good until I noticed that the standard output was not being reported back to LabVIEW. I needed the standard output as this is what I parse to determine if the script was successful or not.

This is very easily solved by piping the standard output from the script to a file and then get LabVIEW to read the file once the script exits. This does add an extra step, but by executing the script in this way, it runs and exits cleanly every time, being much more reliable than using the batch file. This is my final string that was used.

C:\Users\gpayne\bin\mintty.exe -e /bin/bash -c '/home/gpayne/Test_Script.pl > StandardOutput.txt'

 LabVIEW system Mintty bash Perl script output

After trying both methods, I settled on using Mintty instead of Windows batch files. They seemed a lot more reliable over many executions.

This method can surely be expanded to running Python scripts too, which I will leave for another day.

As usual, please direct any questions, comments or tips to my email or on Google+.

Greg