LabVIEW: Web Services Part 3

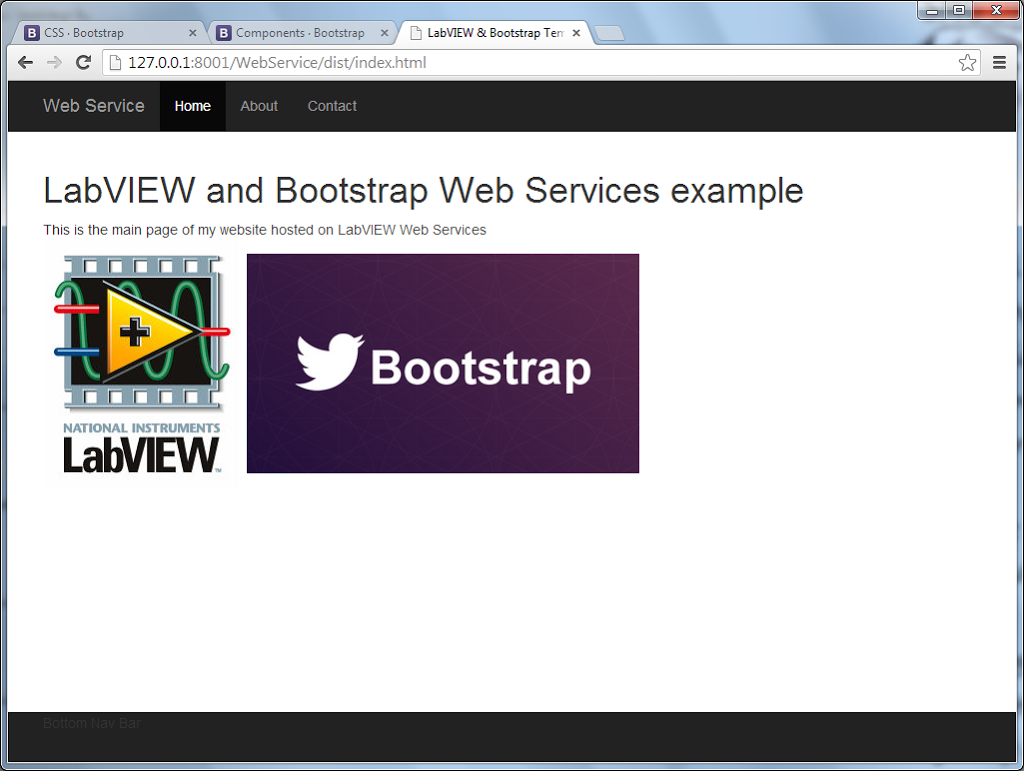
In Part 2 we had a look at connecting hardware and toggling the state on two LED’s using a form and a method VI.

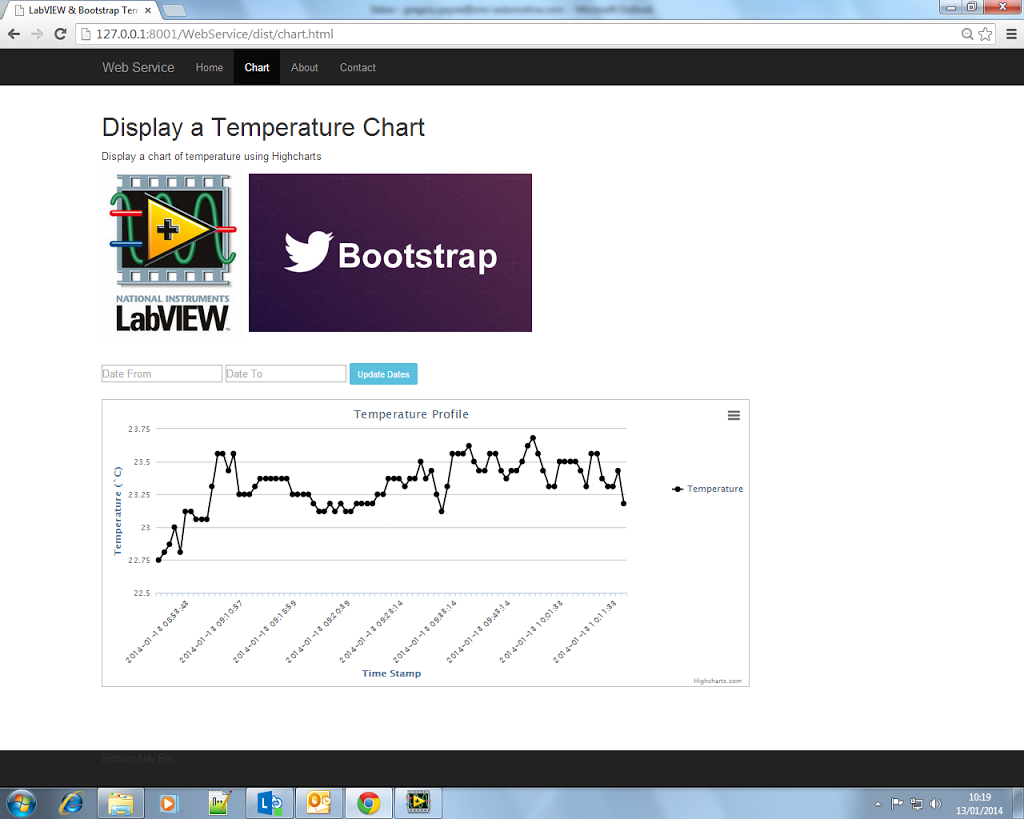
Moving to the next stage of my project, I added a DS18B20 temperature sensor to log the temperature at set intervals. This interval is defined by using a variable constant. The temperature is logged to an SQLite3 database and when queried, displays the temperature profile in a Highcharts chart in the browser. Dates to display are chosen using a jQueryUI datepicker.

Logging temperature:

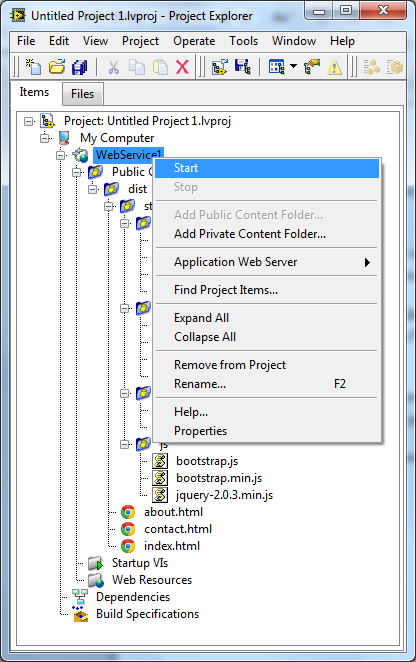
Temperature is logged every 60 seconds as set by Constants.lvlib:TemperatureLogDelay.vi. This VI is opened and run by reference from within Startup.vi when the server is started. It continues to run in the background as long as the server is running. 

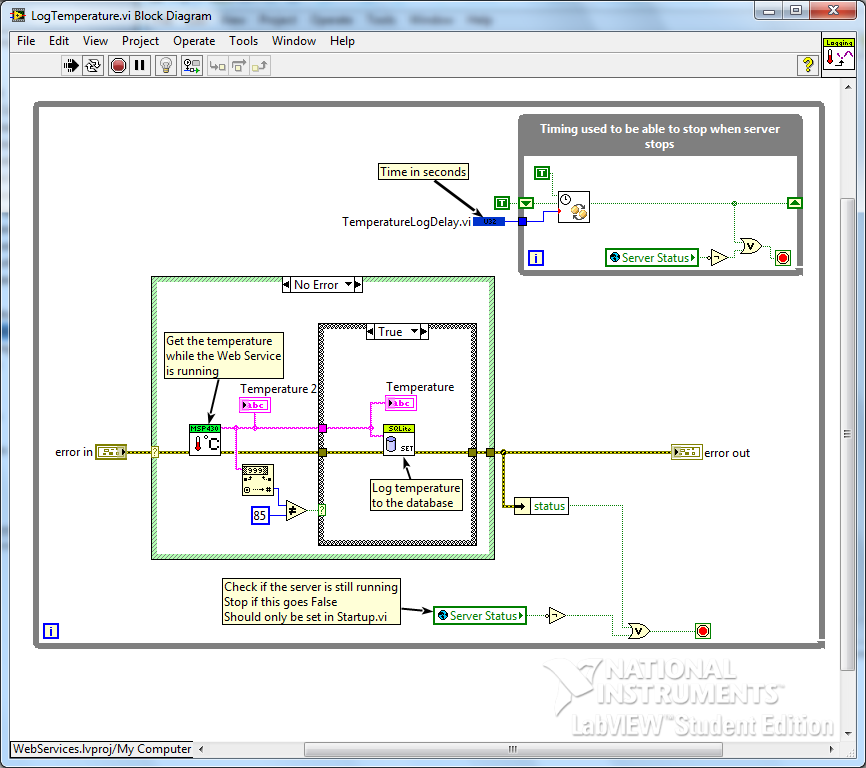
Once the temperature has been read from the LaunchPad, it is logged in an SQLite3 database. I used a library written by Dr James Powell which can be downloaded from the LAVA Code Repository

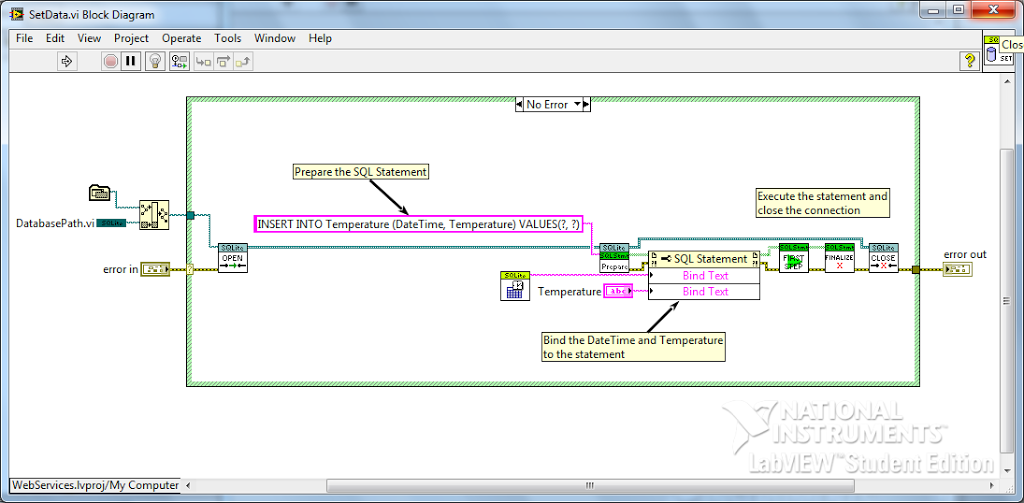
The temperature is logged alongside the current date and time. The data and time string is used to choose what date range to display in the chart.

Query the temperature:

To query the database for the temperature range that we want to display, I use a jQueryUI datepicker. This gives me the dates that I want to look at and then I add the time in LabVIEW. I use a form with another GET method to pass the dates into LabVIEW and then I run the query there. 

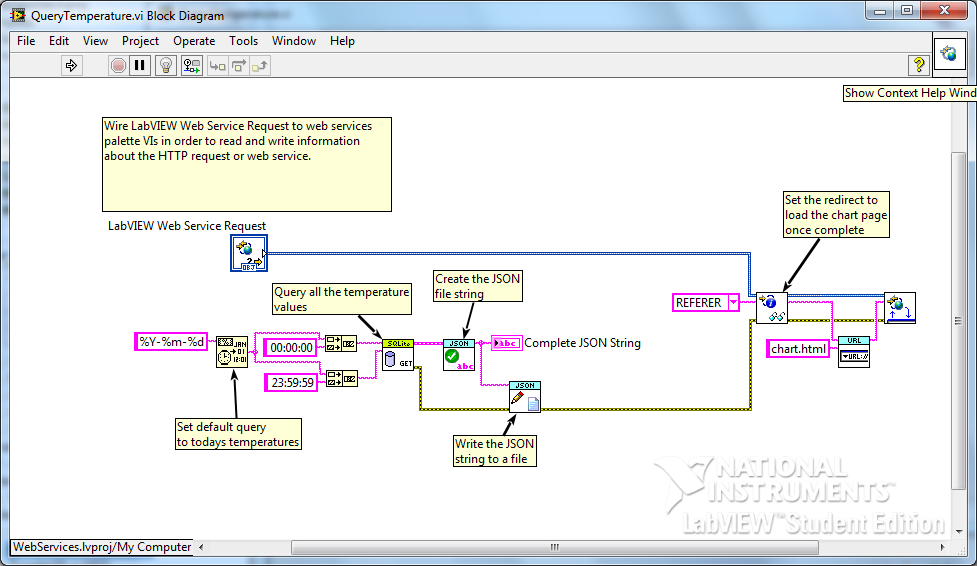
The data gets returned from the query in the form or arrays.

Create JSON file:

Once I have an array of dates and temperatures, I need to reformat the arrays into a JSON string which Highcharts can understand. I start off my formatting each array into the correct format string and then create the complete JSON string. 

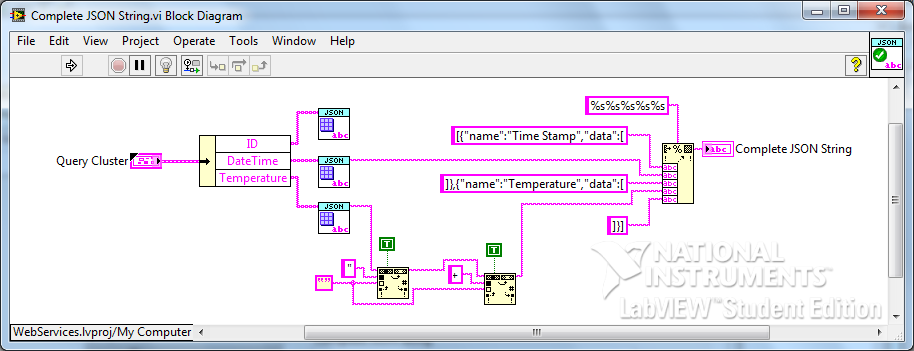
This string is then written to a .json file which is read by the javascript to display the chart.

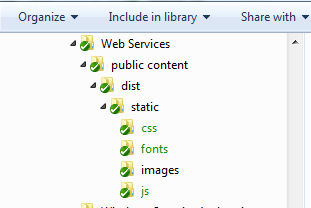
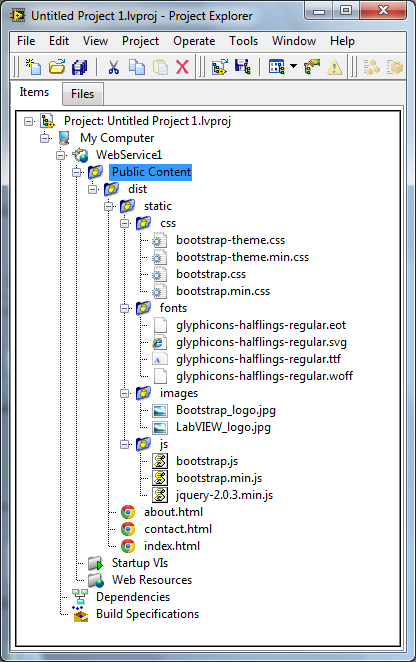
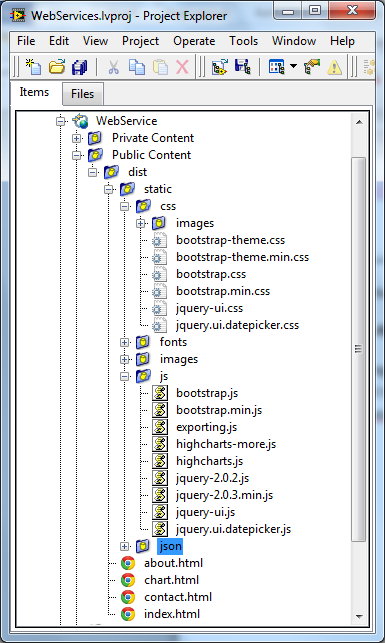
Adding static files:

As we are using more API’s, we need to add these files to the static directories. To the static/css directory, add the jQuery datapicker theme. To the static/js directory, add the Highcharts, jQuery and jQuery datapicker js files. 

Editing chart.html:

The last thing to do is to add the <script> and html code to display the datepicker and chart. 

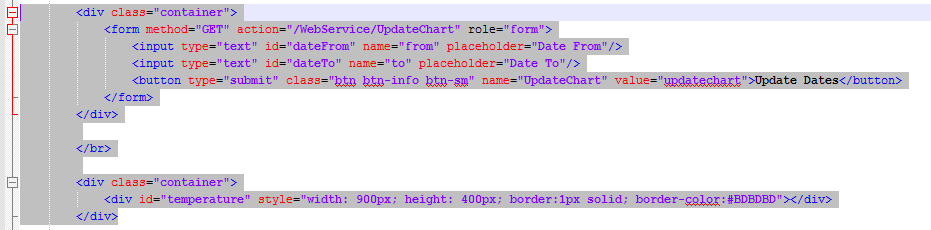
If no dates are selected, the today’s dates will be chosen by default.

A JSON file is then created from the query results. This file is saved into the static/json directory where it is read from within the script.

The webpage is then updated with the chart showing the temperatures for the dates selected. The settings of the chart and also the type of chart can be changed to whatever you like. Have a look at the Highcharts API for all the options. 

That is all for Part 3. You can find Part 2 here and Part 1 here. The completed project so far can be downloaded from below.

As always, comments and tips are always appreciated. 

Download LabVIEW Web Services Part 3

Greg

LabVIEW: Web Services with Twitter Bootstrap

I have been playing around with the updated Web Services feature in LabVIEW 2013 the last few days. My plan is to write a few posts where I create a simple website hosted by LabVIEW which can control some hardware from the browser.
 
I have done this in the past with my Raspberry Pi, but wanted to give it a go using LabVIEW instead.
 
This first post will cover how to set up the project, how to serve static pages and also how to link in third party code. The two third party products that I will be using are Twitter Bootstrap and jQuery.
 
Here is the website that will be designed in the post.
 
Start off by creating a blank project from LabVIEW templates. Save the project and then in the project, right click on My Computer and select New > Web Service.
 
 
This creates the Web Service in your project.
 
 
Create the folder structure in Windows Explorer for your public content. I use the following structure created in the project root directory:
 
 
Once the folder structure has been created, it needs to be added to the project. Add the folder by right clicking on WebService in the project and selecting Add Public Content Folder. Navigate to the Public Content folder created in the previous step and click Select Folder.
 
 
Now that the folder structure has been created, we need to add the source files. Download my project here to get the Bootstrap, jQuery, html and images that I used. Add them in Windows Explorer and they will be automatically added in the project as the folders are set to Auto Populate. Once you are done the project should look like this.
 
 
Use the Bootstrap and jQuery links above to get the latest versions if you want. Then just replace the files.
 
Open the three html files in a text editor of your choice. I use Notepad++ which I think is the best editor that I have tried. It also colours the text depending on the language used and is open source.
 
When linking to the css, js, jpg files from html, the path is relative to the html path. In this project you will use the path “static/folder/file” where folder is the type of file and file is the full file name including extension. 
 
Now that we have the files and project in place we are ready to run the server and open the webpage, but first save the project and all the components.
 
Right click on WebService and select Start. This will bring up a dialog to display that the webserver is running.
 
 
Now you need to get the URL to connect to. Right click on index.html and select Show Public URL. Copy the URL that is shown in the dialog.
 
 
Once you have the URL copied, close the dialog and paste the URL into a browser. Your webpage should now run. Once running, you can navigate between the three html pages using the links at the top of the page.
 
If you decide to change the html code, you do not need to restart the server after each change. All you need to do is refresh the browser.
 
That is it for Part 1. I will now make some changes and get Part 2 up as soon as I can.
 
If you have any comments, questions or tips for me, please leave a message in the comments section below. Thanks for reading.
 
Greg